
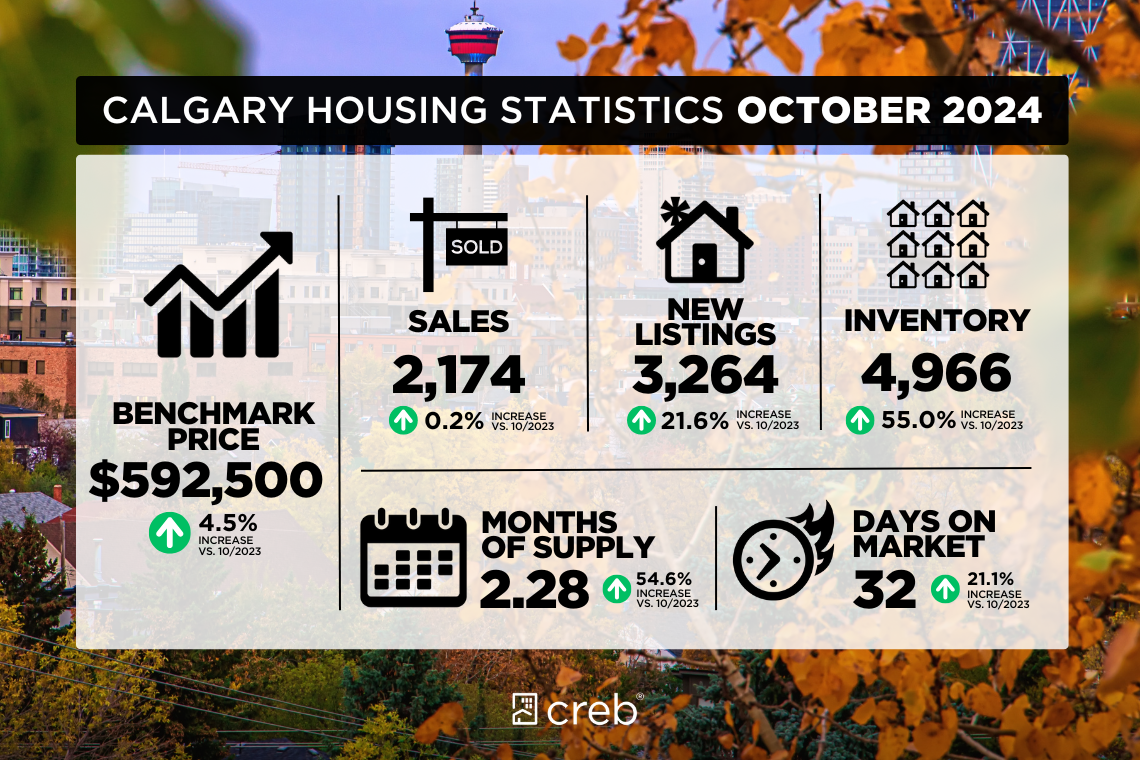
Sales gains for homes priced above $600,000 offset declines at the lower end of the market, resulting in October sales that were similar to last year. The 2,174 sales in October increased over September and stood 24 percent above long-term trends for the month.
“Housing demand has stayed relatively strong in our market as we move into the fourth quarter, with October sales rising over last month,” said Ann-Marie Lurie, Chief Economist at CREB®. “However, activity would likely have been stronger if more supply choices existed for lower-priced homes. Supply levels in our market are improving relative to the ultra-low levels experienced last year, but much of the gains have been driven by higher-priced units for each property type. This results in conditions far more balanced in the upper end of the market versus the seller's market conditions in the lower to mid-price ranges of each property type.”
The gains in new listings relative to sales over the past six months have supported inventory gains in the city. As of October, 4,966 units were available, a significant improvement over the near-record low of 3,205 units reported last October. While inventories are starting to reach levels more consistent with long-term trends, the inventory composition has changed as nearly half of all the residential inventory is now priced above $600,000.
Adjustments in supply are helping move the market away from the tight market conditions experienced in the spring. However, conditions remain relatively tight, with 2.3 months of supply and a 67 percent sales-to-new listings ratio, and the months of supply do vary significantly by price range and property type. For example, detached homes priced below $700,000 are reporting less than two months of supply, while homes priced over $1,000,000 are reporting over three months of supply. This is likely resulting in different price pressures depending on price range and property type.
Overall, the total residential benchmark price was $592,500 in October, over four percent higher than last October and on a year-to-date basis, averaging over eight percent higher than last year's levels. The unadjusted benchmark prices did ease slightly over last month due to seasonal factors, as seasonally adjusted prices remained relatively stable in October compared to September.

Housing Market Facts
DETACHED
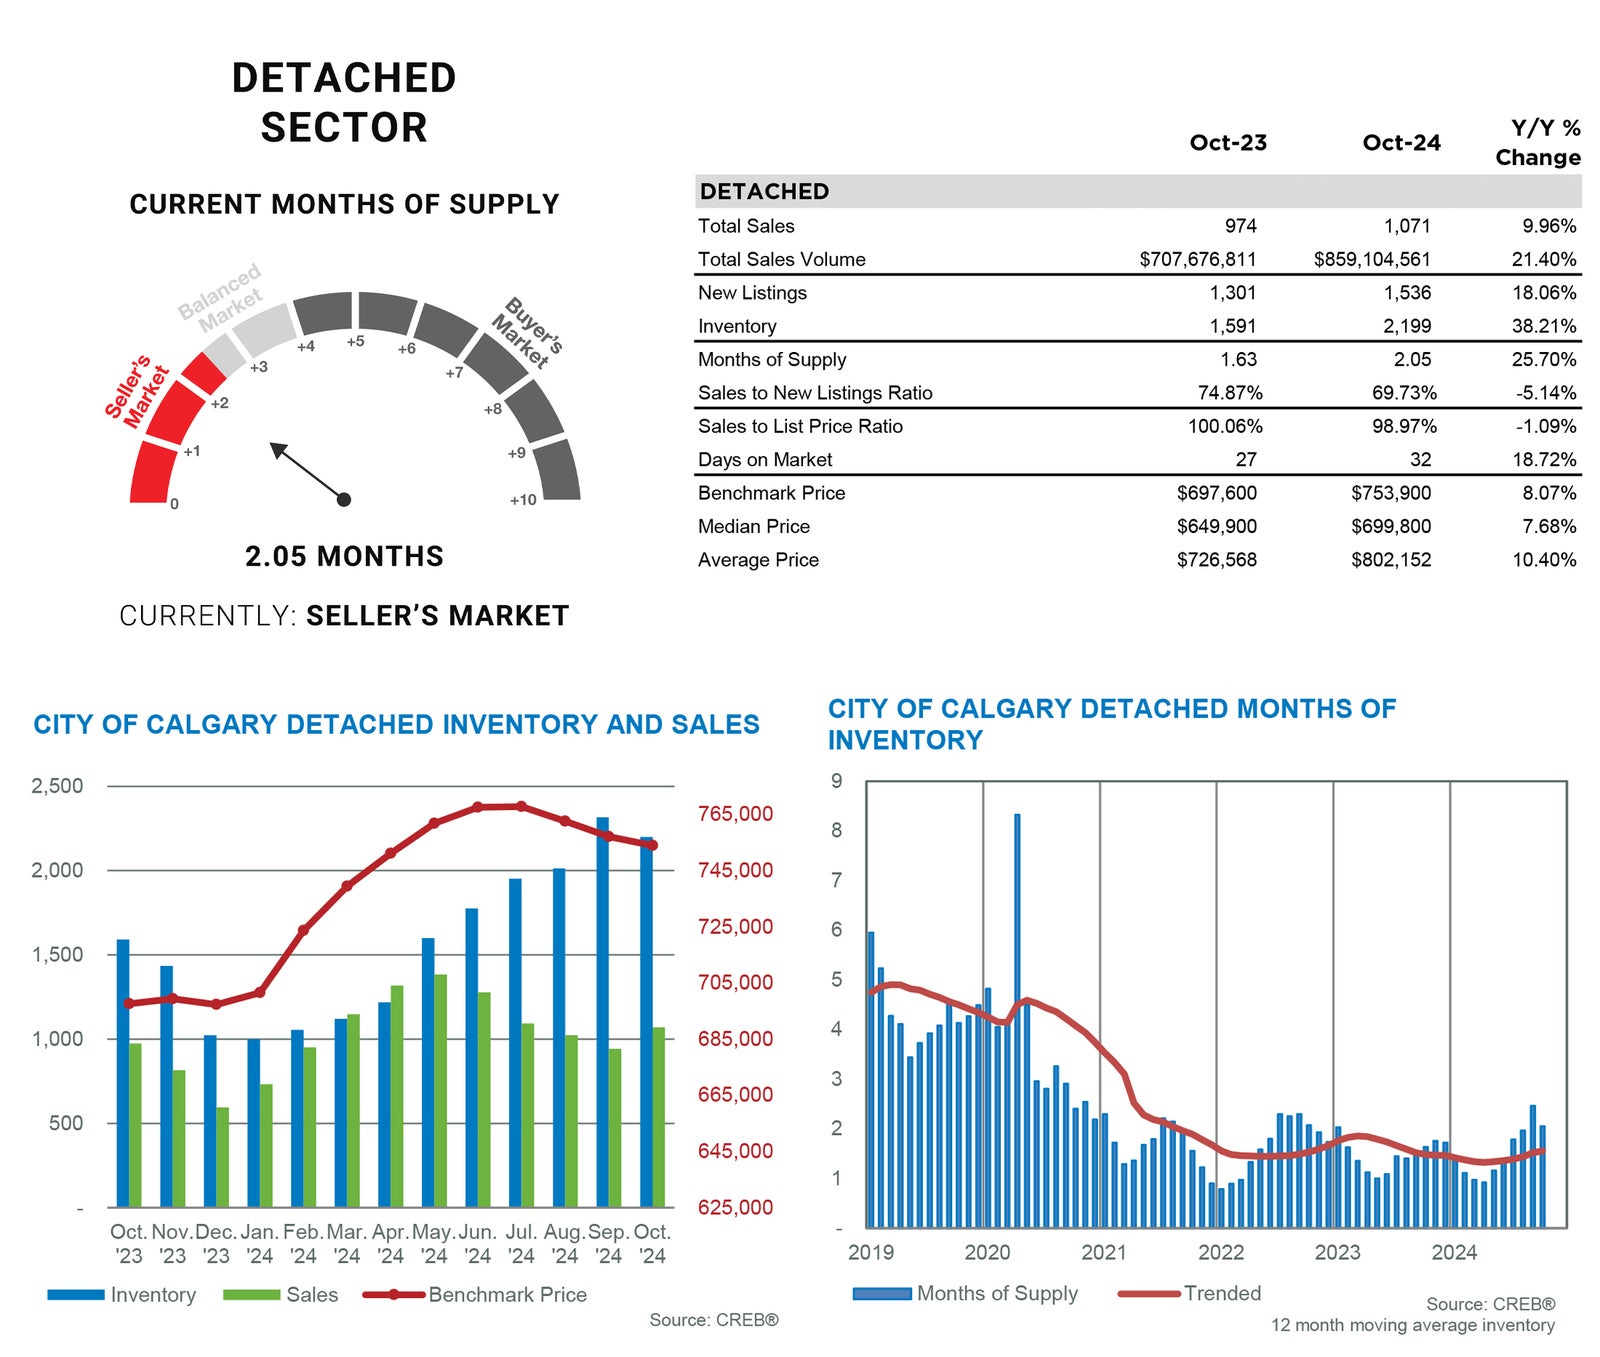
Home sales rose to 1,071 in October, a gain over last month and nearly 10 percent higher than last year. While new listings were higher than last year, they slowed over last month, causing the sales-to-new listings ratio to rise to 69 percent and preventing any further monthly gain in inventory levels. With 2,199 units available, the months of supply remained near two months, a gain over the under two months reported last year at this time, but slightly lower than last month.
The unadjusted detached benchmark price was $753,900 in October, slightly lower than last month but still eight percent higher than levels reported last October. Additional supply choices in the higher price ranges have taken some of the pressure off home prices. However, the recent monthly pullbacks are more related to seasonal conditions, as seasonally adjusted prices have remained relatively stable over the past three months.
SEMI-DETACHED
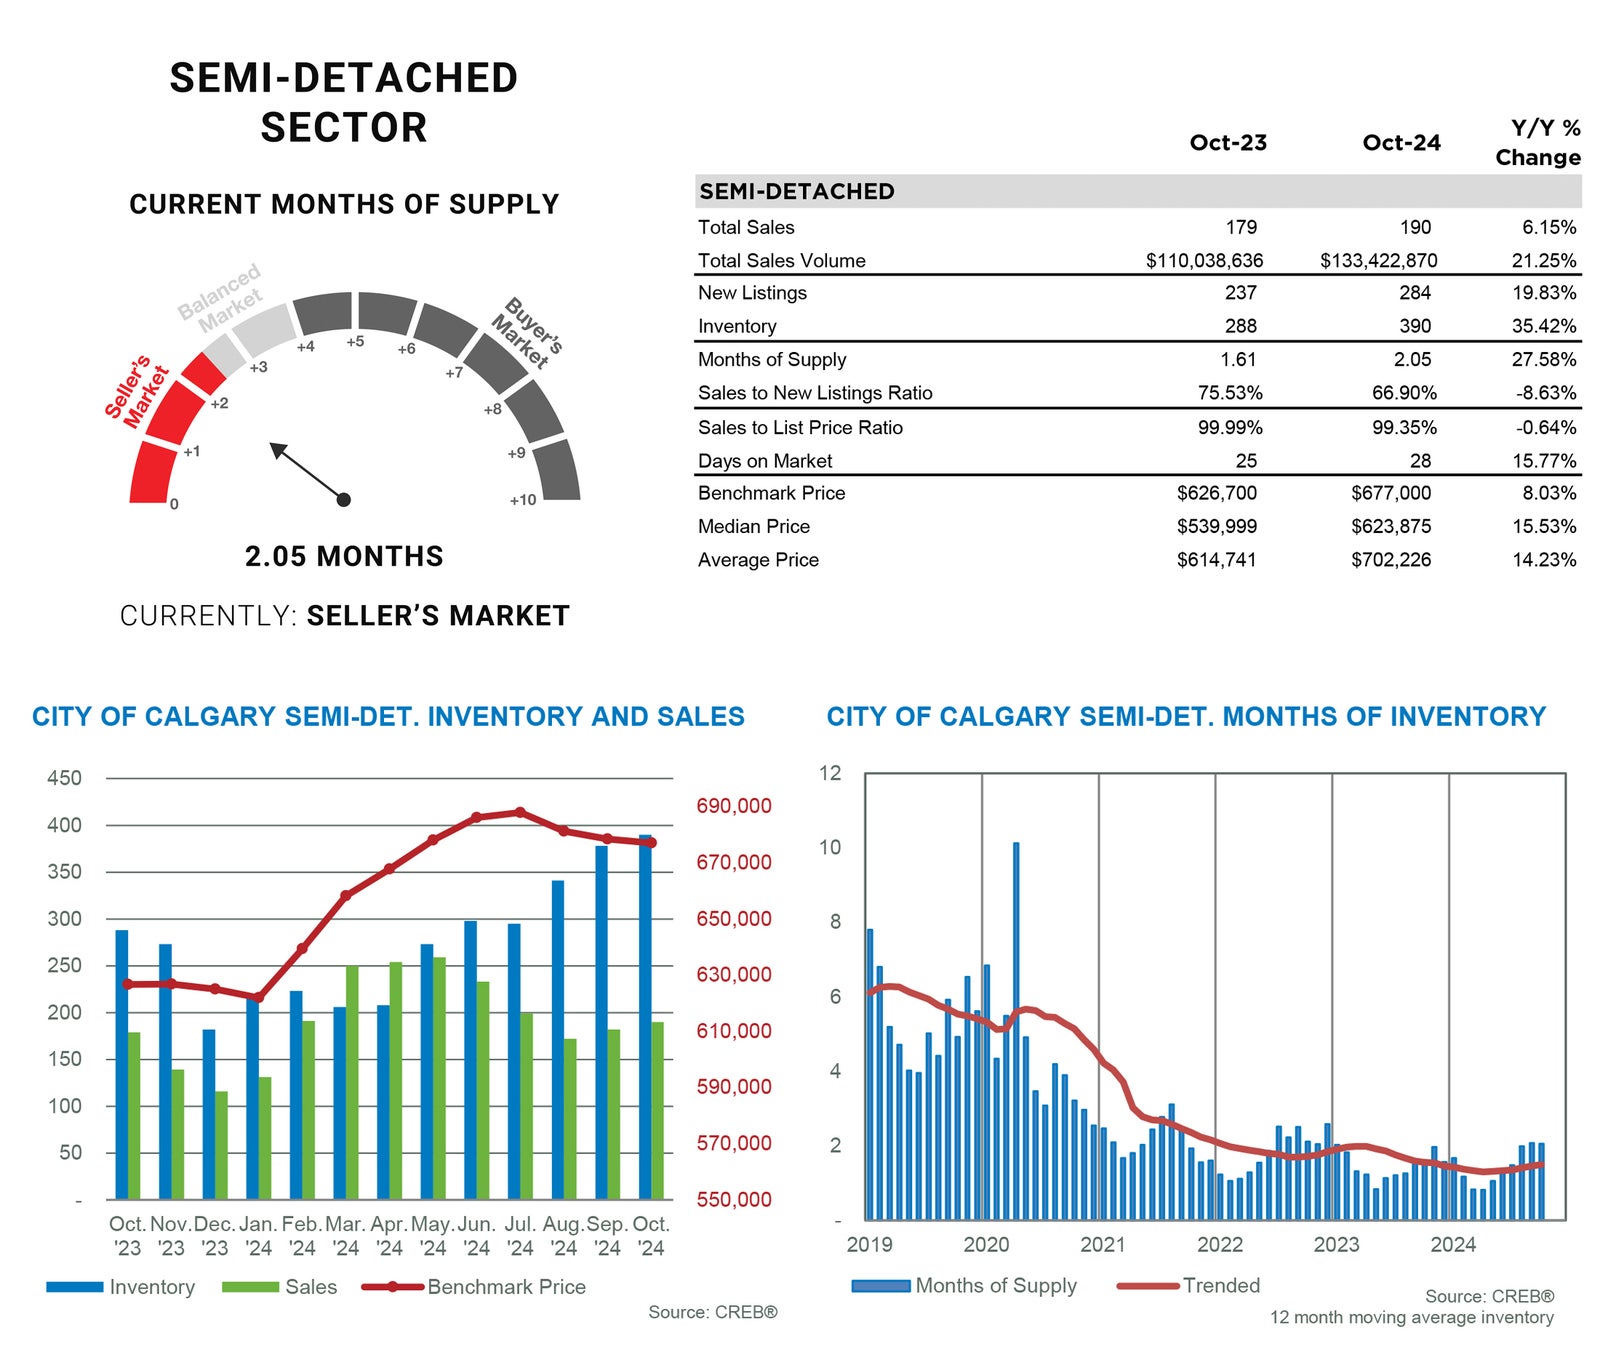
Sales in October rose over last month and were over six percent higher than levels reported last year at this time, contributing to the year-to-date growth of over three percent. New listings for semi-detached homes have also been on the rise, supporting some steady gains in inventory levels. The shift in supply compared to demand has helped push the market toward more balanced conditions, especially for higher-priced properties. However, with only two months of supply, the overall conditions still favour the seller.
The unadjusted benchmark price was $677,000 in October, similar to last month and over eight percent higher than last year. Year-to-date prices have averaged an over 11 percent gain.
TOWNHOME/ROW
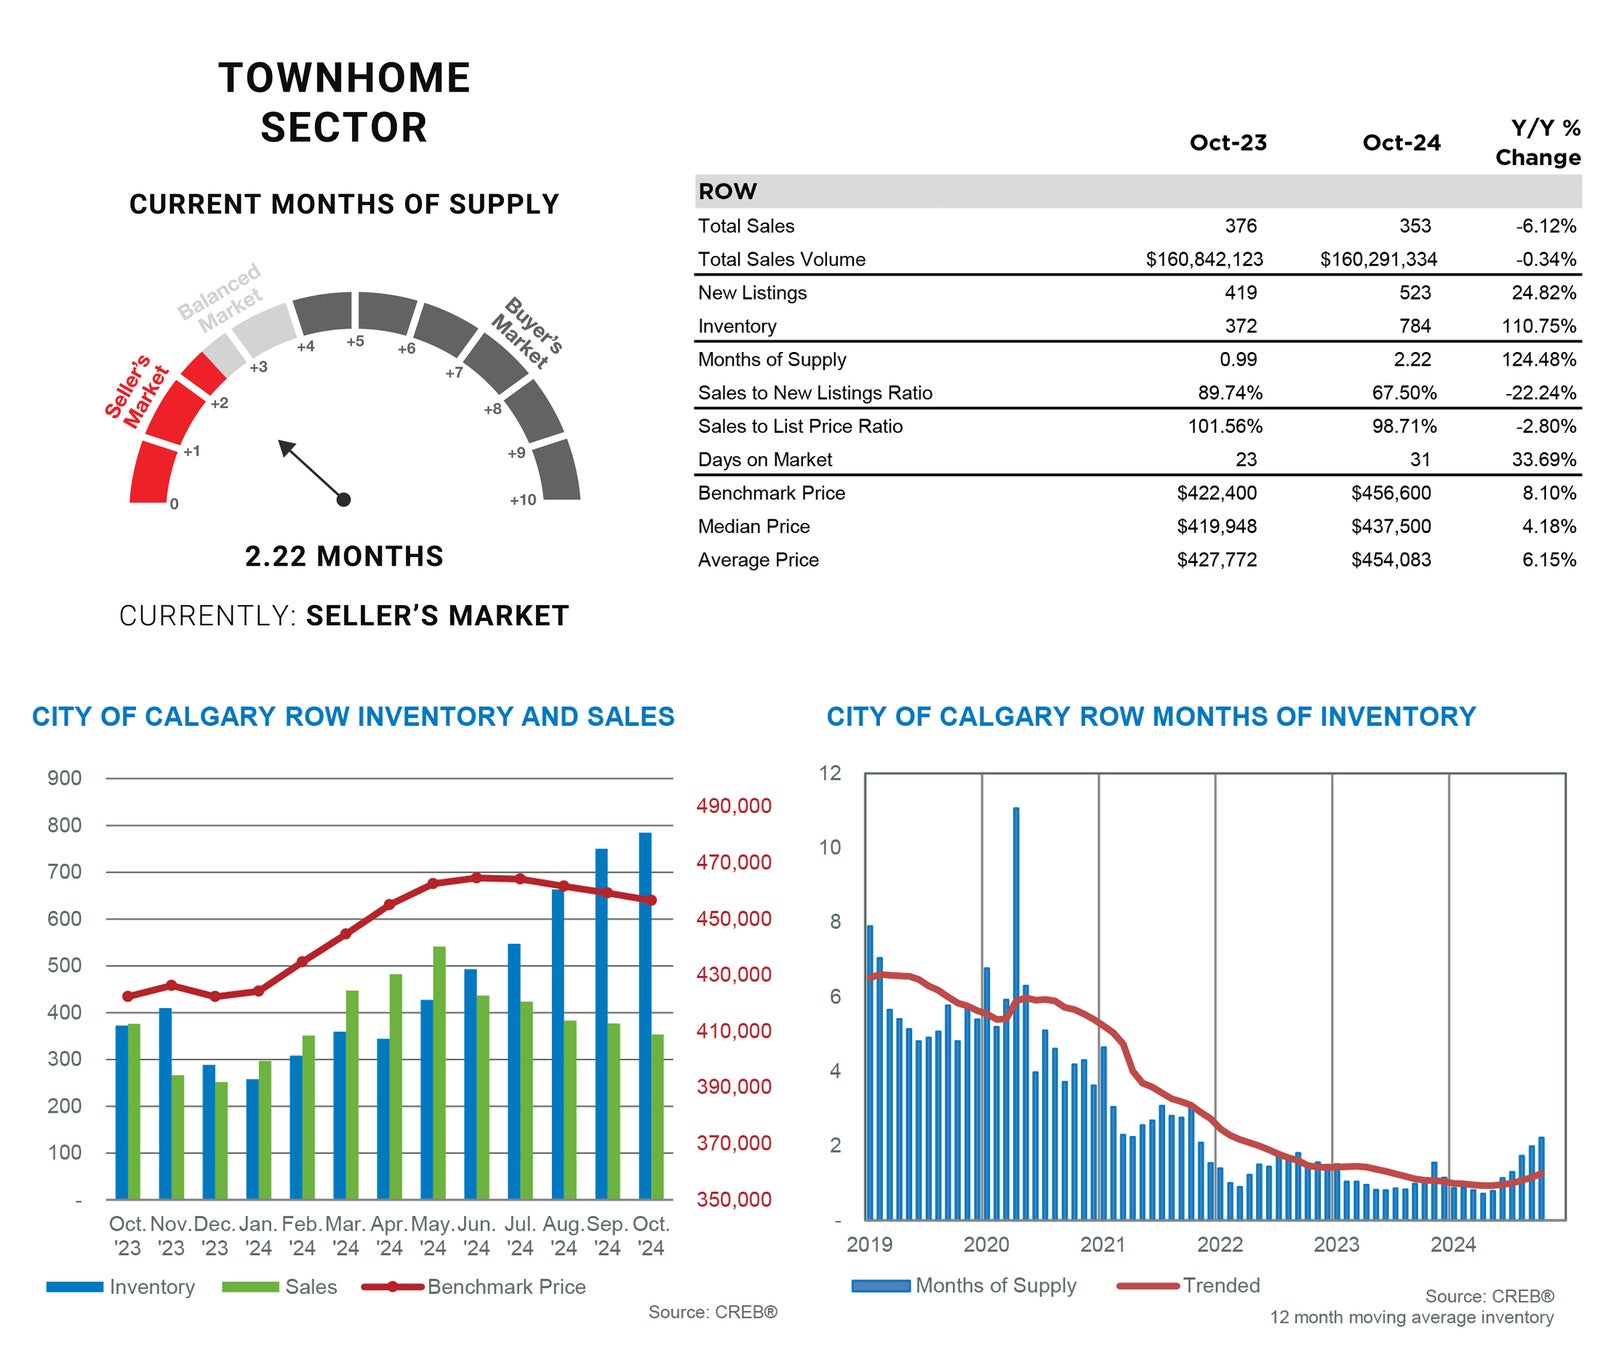
Following a strong start to the year, sales activity has slowed since June. However, the pullback in sales is not due to a shift in demand but related to supply constraints. The declines in sales have been driven by homes priced under $400,000, the same segment of the market which reported a 35 percent decline in new listings. Year-to-date sales have remained relatively stable compared to last year, as pullbacks in the lower range offset the gains in the upper price ranges. Over 70 percent of the sales have occurred over $400,000, a significant shift from last year, where the upper end accounted for 47 percent of all the sales.
Improvements in supply did cause the months of supply to push above two months in October, the first time that has happened since the end of 2021. Supply growth, especially in the upper price ranges, has helped take some pressure off prices. However, with an unadjusted benchmark price of $456,600, prices are still over eight percent higher than last October and year-to-date, which have averaged an increase of nearly 16 percent.
APARTMENT
While sales in October improved over last month, October marks the fifth consecutive month with a year-over-year decline. However, it is important to note that the 6,782 sales so far this year are only down slightly over last year's record high and nearly double the number of sales we have averaged over the previous decade. Higher lending rates, rising rents, and limited supply choices for lower-priced properties have fuelled demand for apartment condominiums. However, like other property types, sales declines were driven by pullbacks for lower-priced units due to a significant drop in supply. Inventory levels in October did rise over the previous year, with most of the gains occurring in the $300,000 - $500,000 range, supporting more balanced conditions in those price ranges. Meanwhile, conditions remained relatively tight for lower-priced condominiums.
The additional supply choices, especially in the higher ranges of the condominium market, are taking some of the pressure off prices. In October, the unadjusted benchmark price was $341,700, down over last month but still 11 percent higher than last year's levels. While much of the monthly decline can be attributed to seasonal factors, areas with a relatively high number of newly constructed and completed projects are impacting resale activity, resulting in a slightly higher monthly decline. Nonetheless, on average, year-to-date prices are nearly 17 percent higher than levels reported last year.

